Air sampling in team congregate spaces for early detection of respiratory virus threats at the 2026 FIFA World Cup™
Air sampling in a national team during the World Cup
Respiratory infection, team sport, athlete health, public health
The recommended way to view this preprint is at https://dholab.github.io/team-canada-world-cup-2026/. The online version includes interactive figures and improves the reading experience.
Authors
David Simon,¹ Timothy J. Locksmith², Nicholas R. Minor², Isla E. Emmen², Nancy A. Wilson², Eli J. O’Connor², Shelby L. O’Connor&2, David H. O’Connor&2
Affiliations
- Canada Soccer, Ottawa, Canada; University of Bath, Department for Health
- Department of Pathology and Laboratory Medicine, University of Wisconsin School of Medicine and Public Health, University of Wisconsin-Madison, 5510 Elements Way Suite #500, Madison, WI 53719, USA
& denotes equal contribution
ORCID iDs
- David Simon: 0000-0003-0911-7152
- Timothy J. Locksmith: 0009-0007-1112-6759
- Nicholas Minor: 0000-0003-2929-8229
- Isla E. Emmen: 0000-0002-4725-4935
- Nancy A. Wilson: 0000-0002-9472-6026
- Eli J. O’Connor: 0009-0001-8795-8320
- Shelby L. O’Connor: 0000-0003-0183-5010
- David H. O’Connor: 0000-0003-2139-470X
Corresponding author
David H. O’Connor, Department of Pathology and Laboratory Medicine, University of Wisconsin School of Medicine and Public Health, 555 Science Drive, Madison, WI 53719, USA. Email: dhoconno@wisc.edu; Tel: +1 (608) 890-0845.
Key public health message
What did you want to address in this study and why?
Respiratory infections are the most common illness at major sporting events, but they are usually found only when someone notices symptoms and reports them. That misses infections in people who feel well or who choose not to say anything. We hypothesized that sampling and quickly testing the air of the shared rooms a national team occupies in a hotel would identify respiratory viruses, and that this could provide a behaviour-independent tool for improving elite athlete health.
What have we learnt from this study?
Air sampling with same-day testing worked in practice across five host cities and a month of competition. Most samples were negative, but viral genetic material was found in team rooms in every city. Some signals coincided with a febrile player and visibly unwell hotel staff.
What are the implications of your findings for public health?
Air sampling is a practical way to watch a shared indoor space for respiratory viruses without testing individuals or collecting personal data. When viruses are detected in a room, low-cost precautions such as ventilation, air cleaning or excluding unwell staff can be implemented. The same approach could be used for teams, delegations, and other groups housed together at mass gatherings in Europe and elsewhere.
Abstract
Background. Respiratory infections are the leading cause of illness at major sporting events, yet surveillance relies on athletes recognising and reporting symptoms, missing asymptomatic, pre-symptomatic and unreported infections. During competitions, teams are housed together and share spaces with members of the broader community.
Aim. To evaluate whether continuous air sampling with point-of-care testing could detect respiratory-virus nucleic acids in an elite team’s congregate spaces during competition, and whether the signals were operationally useful.
Methods. Prospective, descriptive environmental-surveillance study following the Canadian men’s national soccer team across five host cities during the 2026 FIFA World Cup™ (3 June to 4 July 2026). InBio Apollo bioaerosol samplers ran continuously in up to four team-designated rooms per hotel (physiotherapy, meal, equipment and coaches’ room or hallway); filters were changed approximately twice daily, eluted on-site and tested with the Cepheid Xpert® Xpress SARS-CoV-2/Flu/RSV plus assay. A sample was considered positive if any cycle-threshold (Ct) value was reported, as less than 45, for a target.
Results. Of 174 air filters, 13 yielded detections of viral genetic material (9 SARS-CoV-2, 3 influenza A virus, 1 influenza B virus, 0 RSV). Detections were sparse early and clustered late in the tournament. An influenza A signal appeared the morning a player was sent home febrile, and SARS-CoV-2 signals coincided with visibly ill hotel staff, with signals falling after ill staff were excluded.
Conclusion. Air sampling with point-of-care testing is feasible in the context of an elite team and can surface behavior-independent viral signals during competition that may offer opportunities for earlier precautionary actions.
Introduction
Acute respiratory illness is the most common non-injury medical problem in elite sport and is consistently the single largest illness category at major sporting events. At the FIFA World Cup Qatar 2022™ it accounted for 80% (12 of 15) of all time-loss illnesses among players [1], and it was the leading illness category at the 2018 and 2020 Youth Olympic Games [2,3]. Elite athletes also carry elevated risk: at the 2019 Nordic World Ski Championships they had roughly a sevenfold higher risk of symptomatic respiratory infection than matched controls outside of the team [4], and infections spread readily within teams, most often within the same sport discipline [5,6].
Shared housing, communal meals, travel, and crowded indoor spaces are repeatedly identified as risk factors [7,8]. Team hotels concentrate these hazards, gathering susceptible athletes and staff in a closed, shared-ventilation environment. There, athletes and staff can be exposed both by one another and by other hotel occupants. Even if the athletes do not stray from the team environments, other hotel staff could bring viruses from the community into the team’s setting. The main infection route is inhalation of virus-laden aerosols, which accumulate and travel beyond close range in poorly ventilated air. Larger droplets can transmit virus during close face-to-face contact, and, less often, so can contact with contaminated surfaces [9].
Symptom-triggered surveillance is behavior-dependent, because infections are only ascertained when a person feels unwell, chooses to seek care or testing, and is correctly diagnosed. It misses or underestimates three situations that matter in team settings. First, asymptomatic and subclinical infections are common, with roughly a fifth of influenza and SARS-CoV-2 infections estimated to be asymptomatic [10–12], and RSV frequently goes unrecognised in adults [13]. Such infections are invisible to symptom-based monitoring yet can still shed virus and seed transmission.
The second class are symptomatic infections that are never reported or are reported after onset of symptoms. In one community study, only 17% (95% CI 10%–26%) of PCR-confirmed influenza infections received medical attention [14]. Even with highly conditioned athletes attuned to their bodies and close monitoring from trainers, during one professional rugby tournament, symptoms were present for at least a day before being reported to the team physician in more than half of illnesses [15]. In some cases, the incentive to keep competing may work against disclosure of symptoms.
Third, for many respiratory viruses shedding, and probably transmission, begins before symptoms do. This pre-symptomatic window is short, on the order of a day or two, but it is when an infected person is already seeding a shared space while still appearing well, which is why symptom-based detection lags the true course of a potential outbreak. In experimental influenza A infection most shedding preceded peak symptoms [16], influenza B shedding can rise up to two days before onset [17], and SARS-CoV-2 is detectable in the throat within roughly 40 hours of inoculation, before symptoms begin [18].
Elite team athletes cannot live in a pathogen-free bubble. Team members need to travel, hotel staff provide security and meal support, and team members mingle with family members who likely spend time in the surrounding communities. These individuals provide an avenue for a pathogen to infiltrate the team population [19,20].
A behavior-independent environmental signal such as viral nucleic acid in air could reveal a virus in a shared space occupied by people with asymptomatic, pre-symptomatic, or unreported infections. Respiratory viruses have long been recoverable from indoor air, and high-flow bioaerosol sampling is now a practical surveillance tool [21]. In congregate living settings, air samplers in student-dormitory HVAC returns detected SARS-CoV-2 in most cases when a positive resident lived on the same floor [22], and school air sampling has captured SARS-CoV-2 during sustained classroom transmission [23, 24]. Sampling across a range of community settings in Belgium, including nurseries, schools, workplaces, and nursing homes, detected at least one of 29 respiratory pathogens in 85% of 341 air samples, and showed that detection rose with higher carbon dioxide concentrations and poorer natural ventilation [25]. In a Belgian daycare centre, weekly air sampling over a full year combined with untargeted metagenomics recovered respiratory, enteric, and skin-associated viruses in 40 of 42 samples, with seasonal viruses appearing at epidemiologically expected times and complete genomes reconstructed directly from air [26]. Other work has detected viral nucleic acids in congregate settings such as schools and healthcare facilities [27] and at international airports [28].
To our knowledge, continuous indoor air sampling for early identification of viral threats has not been evaluated in the context of congregate elite athlete team communities. In partnership with Team Canada, we performed twice-daily air sampling in four team-hotel spaces during the 2026 FIFA World Cup™ to ask three questions: (1) can respiratory-virus nucleic acids be detected from the air of large, variably ventilated shared rooms that teams occupy; (2) are SARS-CoV-2, influenza A, influenza B, and RSV detectable during a summer competition, when Northern-hemisphere respiratory viruses circulate at low levels [29,30]; and (3) can air-sampling signals provide team physicians with behavior-independent information that is timely and specific enough to inform precautions?
Methods
Reporting follows the STROBE recommendations for observational studies where applicable; because this is a descriptive environmental-surveillance and feasibility study without individual participants, items pertaining to individual-level exposures and outcomes are not applicable.
Study design and setting
We conducted a prospective, descriptive environmental-surveillance study of respiratory-virus nucleic acids in the air of team congregate spaces occupied by the Canadian men’s national soccer team during the 2026 FIFA World Cup™. Sampling began on June 3, 2026 (during the final week of pre-tournament training) and continued as the team moved between host cities, ending on July 4, 2026 when the team was eliminated. In Montreal, Toronto, and Vancouver, samplers were placed in up to four team-designated rooms (physiotherapy, meal, equipment, and coaches’ rooms) at locations approved by the team physician. At the final two venues, room access was more limited, with three rooms sampled in Los Angeles and, in Houston, the coaches’ room was replaced by a team-occupied hallway. Room type rather than a fixed physical space was the unit of sampling, because rooms differed between hotels and varied widely in size and ventilation.
Ethics and consent
This study sampled ambient air in shared congregate spaces and did not collect specimens from, or identifiers of, any individual. The University of Wisconsin-Madison Institutional Review Board has determined that air sampling in congregate settings, where the specific occupants of the sampled space are not known, does not constitute human-subjects research. Sampling locations were used with the agreement of, and coordinated with, Team Canada medical staff.
Air sampling
Air was collected using InBio Apollo ambient air samplers (InBio), a filtration-based active bioaerosol sampler with a manufacturer-stated average flow rate of 540 L/min (≈32.4 m³/h) through its allergen-capture filter [31]. Samplers were positioned on available surfaces within each room and run continuously. These samplers are relatively low cost, at roughly 650 US dollars per unit, which made it practical to deploy several in parallel across the team’s shared spaces. They are also quiet (i.e., under 40 decibels) in operation, allowing them to be positioned discreetly in occupied rooms without interfering with team activities.
Filters were changed approximately twice daily, giving two collection sessions of roughly 8-12 hours each: a daytime session (~07:00–08:00 to ~14:00–16:00) and an overnight session (~14:00–16:00 to ~07:00–08:00). When a room was inaccessible (for example, when the equipment room was locked or the coaches’ room was in use), a single filter was run for ~24 hours. Each filter carried a unique barcode; the sampler location, and the times of filter installation and removal, were recorded for every session. Occasionally, an additional sampler was added to a single room and was used as a second confirmatory air sample for the space.
Sample processing and elution
All processing was performed on-site in a hotel room. Each filter was removed from its 3D-printed cassette holder with forceps and transferred to a tube containing 600–800 µL of phosphate-buffered saline with 0.1% Tween-20 (PBST); 800 µL was used typically. The tube was held at room temperature for ~20 minutes to elute captured material, with intermittent agitation. The eluate was then transferred directly into a Cepheid Xpert® cartridge for testing.
Molecular testing
Eluates were tested on the Cepheid GeneXpert® platform using the Xpert® Xpress SARS-CoV-2/Flu/RSV plus assay, a cartridge-based multiplex real-time RT-PCR that detects SARS-CoV-2, influenza A, influenza B, and respiratory syncytial virus (RSV). Each cartridge was run according to the manufacturer’s instructions.
Definition of a positive detection
We defined a sample as positive for a given virus if the GeneXpert reported any cycle-threshold (Ct) value for that target, regardless of the instrument’s qualitative call. Because the Xpert® Xpress assay applies validated Ct cut-offs to return a qualitative “positive/negative” result optimized for clinical diagnosis from patient specimens, targets with a high Ct near the assay boundary may be reported qualitatively as negative by the instrument. For this type of air surveillance, where the goal is the earliest possible detection of viral signal rather than a clinical diagnosis, we treated any reported amplification as evidence of viral nucleic acid in the sampled air. This lower threshold appears appropriate, though it necessarily trades specificity for sensitivity. Each Xpert® cartridge includes an internal Sample Processing Control that verifies adequate processing. Samples with a non-amplifying control or a probe error, or otherwise determined to be invalid, were excluded from the figures but retained in the study data table.
Outcomes and analysis
The primary output was the presence or absence of each of the four target viruses in each air sample. Ct values were used as a rough proxy for the amount of viral nucleic acid, with lower Ct indicating more material. No sample-size calculation was performed.
Statistical analysis
Analyses were primarily descriptive. Detections were tabulated by virus, room, city, and sampling interval.
Results
Sampling overview
Over 32 days (June 3 to July 4, 2026), we collected and tested 179 air-sample filters for SARS-CoV-2, influenza A (IAV), influenza B (IBV), and RSV across five host cities: Montreal (n = 20), Toronto (n = 36), Vancouver (n = 79), Los Angeles (n = 9), and Houston (n = 35). Five filters (3 in Vancouver and 2 in Houston) were excluded from analysis because of invalid Cepheid GeneXpert tests. The remaining 174 filters were used for all analyses. Sampling covered four team spaces per hotel in Montreal, Toronto, and Vancouver (physiotherapy/treatment room, meal room, equipment/kit room, coaches’ meeting room), three in Los Angeles (no coaches’ room), and four in Houston (the coaches’ room was replaced with a team-occupied hallway). Sampling was briefly interrupted when teams and staffing equipment moved between each city.
Most samples were negative for all four targets. Across the study, 13 filters yielded a detection of at least one respiratory virus: SARS-CoV-2 in 9, IAV in 3, and IBV in 1. No RSV was detected. Detections and their cycle-threshold (Ct) values are summarized in Figure 1.
Detections by city
Detections were sparse and geographically dispersed through the first three cities. In Montreal, SARS-CoV-2 was detected in the meal room on June 5 (Ct 42.8), against an otherwise negative baseline. Toronto also yielded one detection, when influenza A was detected in the physiotherapy room from the overnight session beginning June 9 (Ct 44.9). This value fell beyond the assay’s qualitative cut-off and was reported by the instrument as negative, but it met our detection definition of any reported amplification. In Vancouver, influenza B was detected in the physiotherapy room on June 17 (Ct 38.0) and influenza A was detected in the meal room on the morning of June 23 (Ct 40.6).
Detections became more frequent in the two final host cities. In Los Angeles, SARS-CoV-2 was detected in the meal room beginning on the first sampling day. On June 27, a filter was positive from the meal room in the daytime sampling interval (Ct 34.0). An additional filter was collected overnight from the meal room and also tested positive for SARS-CoV-2 genetic material (Ct 38.0). There were no additional positives before the air sampling supplies were moved on June 29 to Houston, where Team Canada played their Round of 16 match. Houston accounted for 7 of the 13 detections (Figure 2). On July 1, viral genetic material was found in the air of all four sampled areas: the meal room (Ct 40.4), hallway (Ct 42.1), and the physiotherapy room (Ct 43.4) tested positive for SARS-CoV-2, with influenza A in the equipment room (Ct 42.5). On the morning of July 2, only the meal room tested positive for SARS-CoV-2 from the previous overnight collection (Ct 42.7). No viruses were detected again until the morning of July 4 when SARS-CoV-2 was detected on samples at lower Ct values. There was a positive meal-room sample (Ct 35.5) and a positive hallway collection (Ct 37.8). One speculative interpretation, which we advance cautiously and cannot confirm, is that the July 1 signal reflected an introduction from one or more people from outside the team, the removal of the source individual(s) transiently reduced airborne virus, and that the lower-Ct resurgence reflected onward transmission within the team.
Community wastewater surveillance in all five host cities showed that the team’s visits fell in the seasonal trough for all four viruses, so the clustering of air detections in Los Angeles and Houston cannot be explained by unusually high background circulation (online supplemental methods and online supplementary figure 1) in these cities.
Operational context and team responses
A prespecified aim was to determine whether air-sampling signals could give the team physician actionable, behavior-independent information. In Toronto, the influenza A detection in the physiotherapy room (overnight session from June 9, Ct 44.9) coincided with a player being withdrawn from training that morning with a fever. The team physician asked the player to mask and isolate for several days. In Los Angeles, after SARS-CoV-2 was detected in the meal room on June 27, medical staff asked visibly ill hotel personnel to leave the team spaces to reduce exposure, and no respiratory virus was detected in the subsequent June 28 samples, coinciding with the removal. In Houston, following the July 1 detections across multiple team spaces, medical staff again asked visibly ill hotel staff to leave, after which signal was absent on July 2 and returned on samples run from July 3 to July 4 at lower Ct values.
Discussion
Figure 4 summarises the study design, the detections across all five host cities, and the response actions that a positive air signal can trigger.
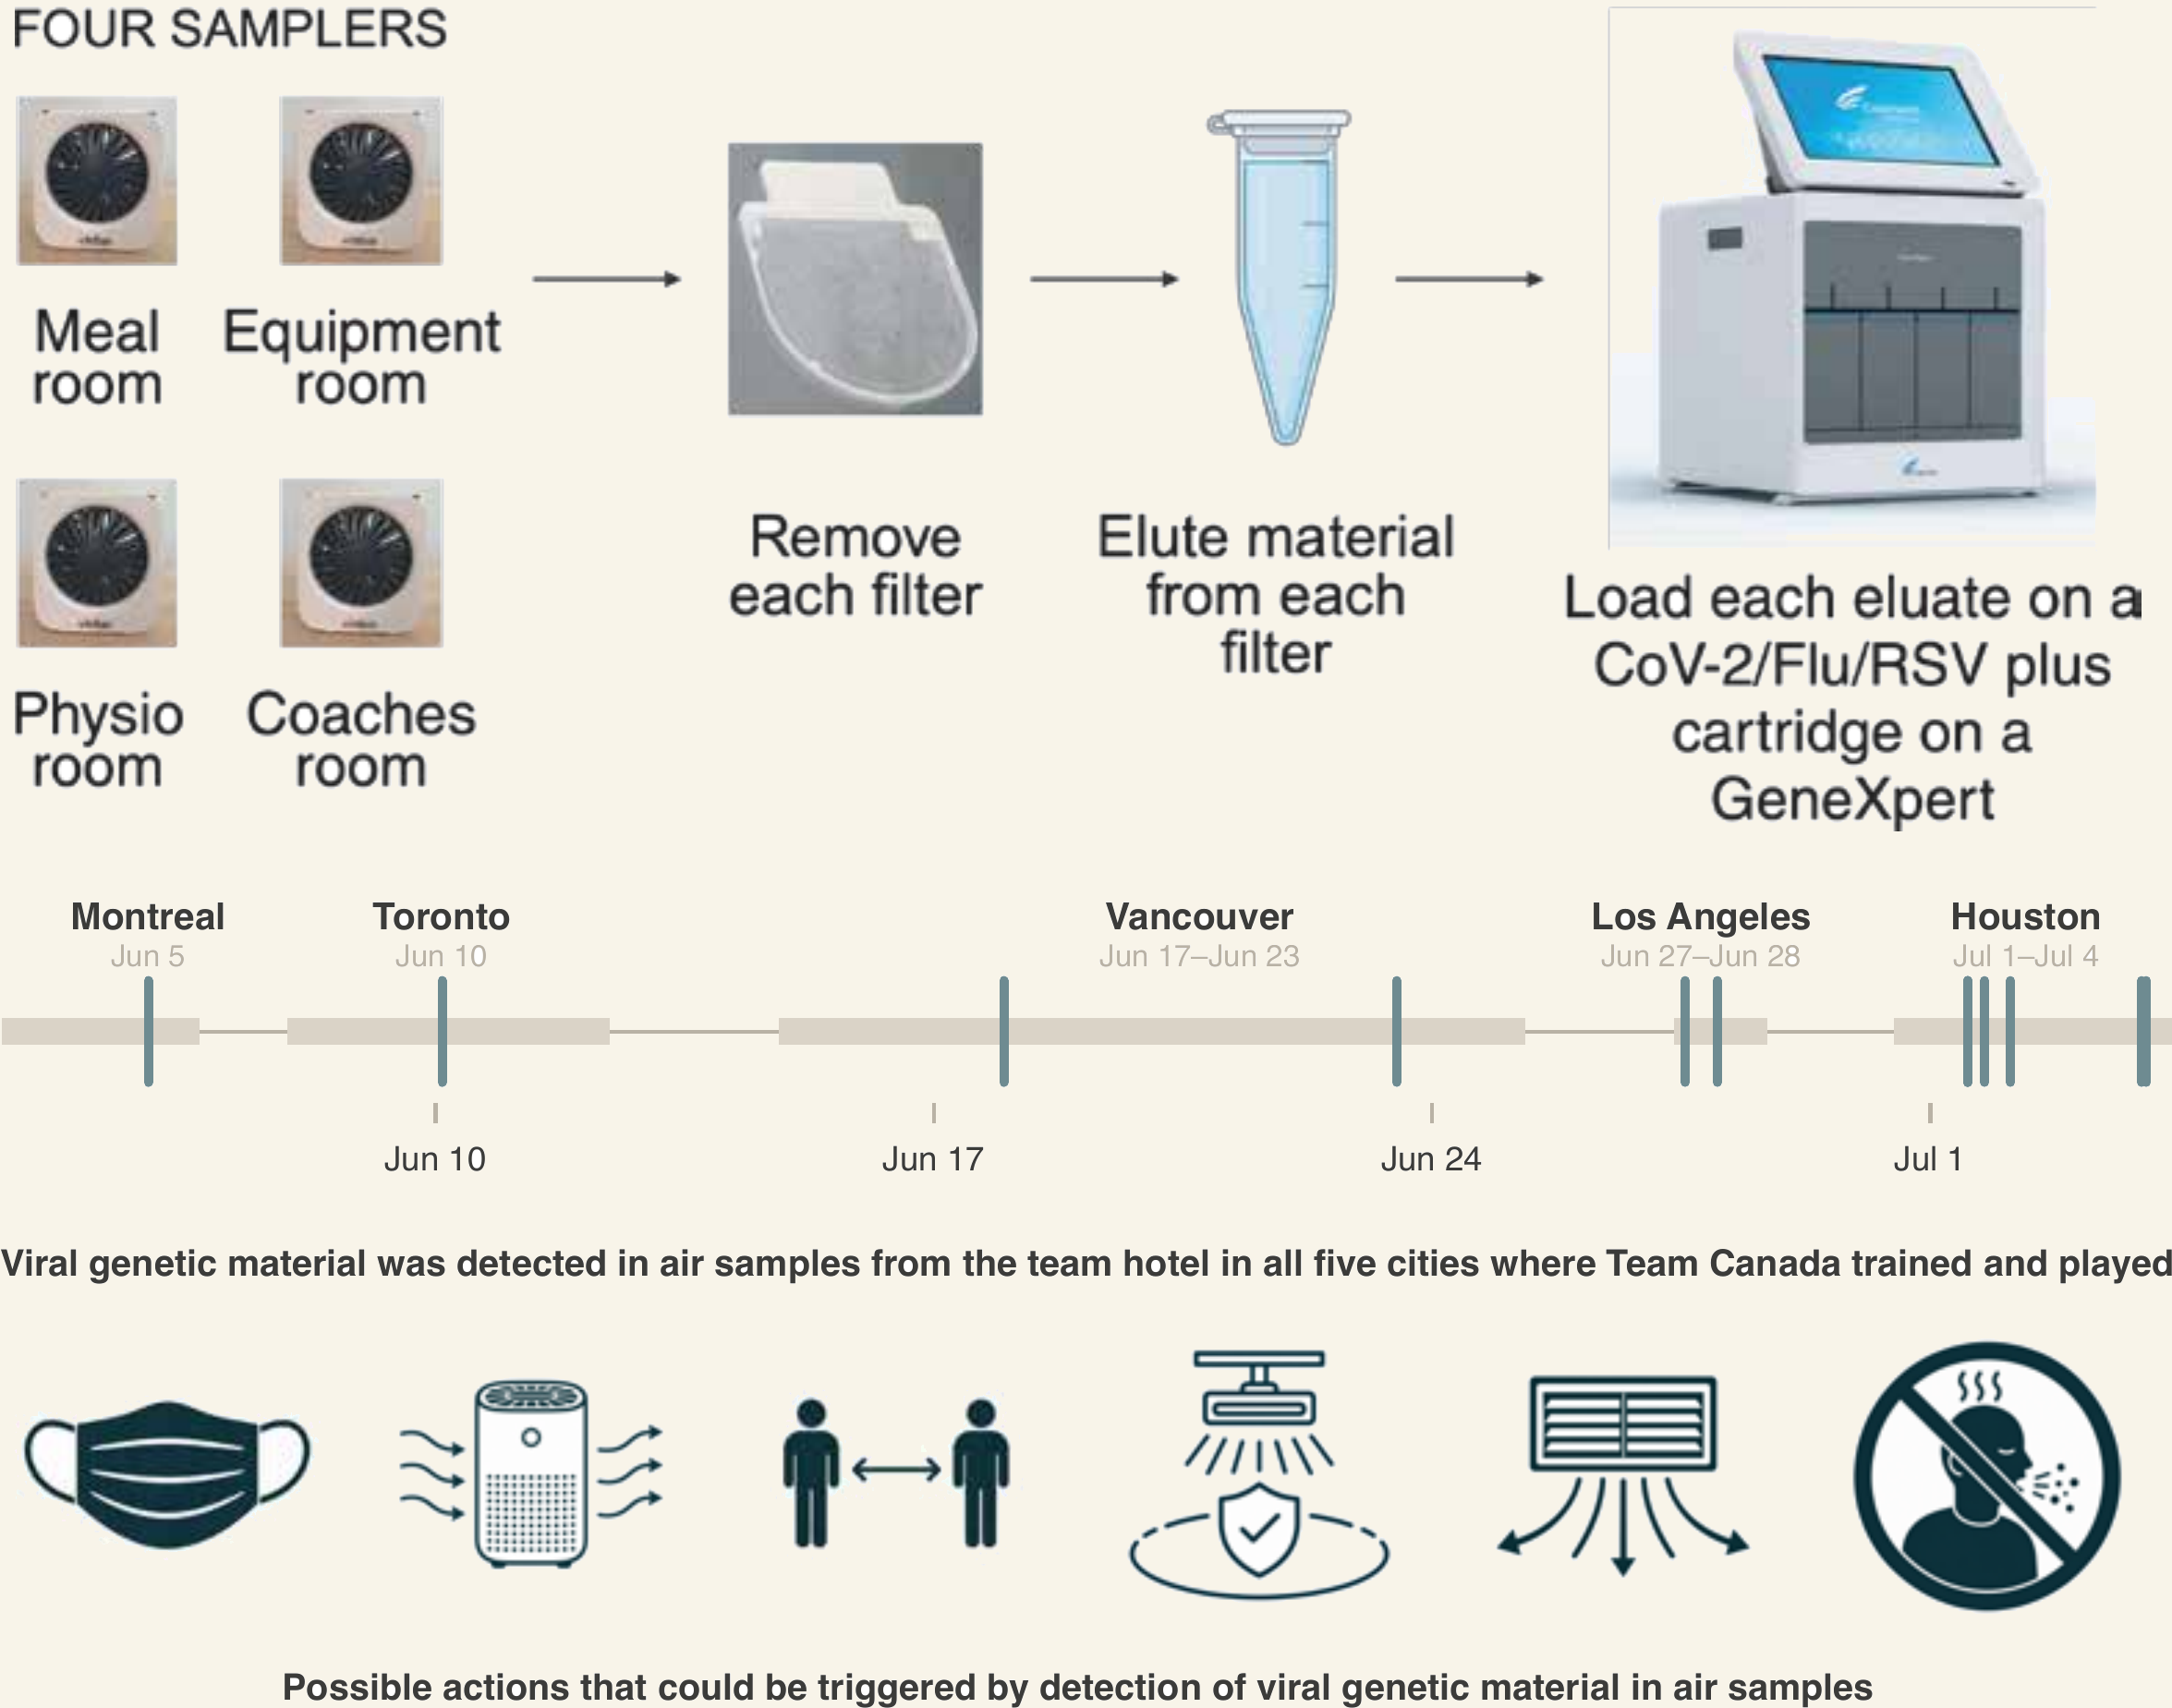
Respiratory illness is consistently the single greatest illness burden in athlete health-surveillance programmes. Over four years of monitoring UK Olympic athletes it caused the largest share of 27,442 illness time-loss days [32], and it remains the leading medical problem at major Games even when prevention campaigns are in place, as at Paris 2024 [33]. Within a squad, congregate living amplifies risk. In a football academy, the SARS-CoV-2 attack rate was three times higher among those who both lived and trained on-site than among those who only trained there [34]. A single infection introduced into shared team spaces during a tournament can therefore threaten both athlete health and competitive availability.
Intensive infection-control measures unquestionably work in this population but are not sustainable indefinitely. Across four major winter-sport events, acute respiratory illness affected 38% of team members at PyeongChang 2018 and 26% at the 2019 World Ski Championships, but fell to 0% and 5% under the multilayered COVID-19 countermeasures at the 2021 and 2022 events, a roughly 10-fold reduction [35], and a parallel cohort showed annual illness incidence in elite skiers falling from 5.3 to 0.3 episodes per person during lockdown [7]. Those disruptive measures, such as quarantine, continuous masking, single-room housing, and restricted indoor facilities, are not compatible with normal competition across a month-long tournament, and illness returned as they relaxed [35]. An early-warning signal could instead let intensive precautions be applied selectively, escalated when risk is detected and relaxed when it is not.
For team medical practice, air sampling offers such a behavior-independent early-warning signal, one that does not depend on athletes reporting symptoms or submitting to individual testing. Even if team members are routinely tested, air sampling can assess whether other employees who occupy spaces in temporary hotel spaces could introduce viruses. This may be especially attractive in elite sports, where athletes may under-report illness to avoid being withheld from competition and where individual testing is logistically and ethically fraught during a tournament. A positive air signal can prompt low-cost, low-regret actions such as reinforcing ventilation [36], adding portable air purifiers [37], incorporating far-UVC lighting in highly trafficked spaces [38,39], masking in the implicated space, reviewing who has access to team areas, excluding visibly ill personnel, and heightening clinical vigilance.
The 2028 Men’s UEFA European Championship will bring 24 national squads to nine venues across eight cities in the United Kingdom and Ireland over a month of competition, and up to 12 of the 32 teams at the 2027 FIFA Women’s World Cup™ will qualify through UEFA. Each of those squads will occupy a succession of team hotels, sharing meal rooms, treatment rooms and equipment stores with staff drawn from each host community. Conducting similar air sampling within these teams could provide an innovative approach to reducing respiratory virus burden in highly consequential, limited duration competitions.
Limitations
First, this is a descriptive, uncontrolled study of a single team. We observed associations between air signals and events on the team, but cannot establish that air sampling caused any reduction in transmission, nor that the operational responses were effective. Second, air detection demonstrates the presence of viral nucleic acid in a shared space. It does not identify who was infected, does not distinguish infectious virus from residual nucleic acid, and documents exposure rather than transmission. Third, our positivity definition (any reported Ct) increases sensitivity at the cost of specificity, and low-level signals near the limit of detection may include contamination or transient environmental nucleic acid. Fourth, the volume of air sampled per session, number of occupants in each space, and their distance from the air samplers are all uncertain, which limits any quantitative interpretation of Ct values. Finally, sampling was opportunistic and constrained by room access, competition logistics, and the team’s elimination, which ended data collection.
Future research
The air samplers used here represent an early generation of the technology and are relatively insensitive, collecting onto a filter that must be removed and processed before any testing. The next generation of samplers is likely to integrate continuous, automated pathogen detection directly into the device. Programs such as the ARPA-H Building Resilient Environments for Air and Total Health initiative are explicitly developing autonomous indoor air biosensors that continuously monitor the biological content of the air and translate it into real-time risk estimates [40]. As these tools mature, approaches to early detection of respiratory threats in athletes should continue to improve in sensitivity, speed, and ease of deployment.
Assay breadth is likely to expand in parallel. Cepheid has described a GeneXpert Respiratory Panel prototype that runs on the same point-of-care platform used here and detects 26 respiratory pathogens, including rhinovirus, enterovirus, parainfluenza viruses, seasonal coronaviruses, adenoviruses, and metapneumoviruses alongside SARS-CoV-2, influenza, and RSV [41]. Applying a panel of this breadth to air samples would let air surveillance capture the common-cold viruses that account for much athlete illness but that our SARS-CoV-2, influenza, and RSV assay could not detect, giving better representation of overall respiratory illness burden.
Conclusion
Twice-daily air sampling with same-day point-of-care testing was feasible in the mobile, high-pressure environment of a national team during a World Cup. Several detections coincided with a febrile player and with visibly ill staff, and prompted the team’s medical staff to act. These findings position congregate air surveillance as a promising, behavior-independent early-warning tool for protecting athlete health, and one that is directly transferable to the team hotels, delegations and congregate accommodation of mass-gathering events in Europe and elsewhere.
Required end statements
Ethical statement
The University of Wisconsin–Madison Institutional Review Board determined that air sampling in congregate settings, where the specific occupants of the sampled space are not known, does not constitute human-subjects research. The study did not collect specimens from, or identifiers of, any individual.
Funding statement
This work was supported by Inkfish LLC and Heart of Racing.
Data availability
The data and code for this study are available in the repository at https://github.com/dholab/team-canada-world-cup-2026. A compressed archive of the Lungfish Genome Explorer project (including imported sequencing reads) used to evaluate sequencing reads found in the July 4, 2026 samples can be accessed from https://dholk.primate.wisc.edu/_webdav/dho/public/manuscripts/team-canada-air-sampling/%40files/Team_Canada_VSP2.lungfish.zip. The original reads before import processing for Lungfish Genome Explorer are in NCBI SRA in Bioproject PRJNA1513008. Note that both the LGE and SRA datasets include data from two additional samples not discussed in the manuscript. During part of the tournament we tested an additional two air samplers for norovirus using the Cepheid GeneXpert and two of these samples that were running at the time of Team Canada’s elimination are included in the sequencing datasets. None of the air samples tested positive for norovirus on the GeneXpert; however, since we did not have complete coverage of the tournament we did not include it in the manuscript’s primary dataset.
Conflict of interest
D.H.O. and S.L.O. are managing partners of Pathogenuity LLC, a consultancy that advises on topics including environmental monitoring for pathogens. D.H.O and S.L.O. are Honorary professorial fellows at the University of Melbourne, Australia.
Use of artificial intelligence tools
Claude Opus 4.8 (high reasoning), Claude Opus 5 (high reasoning), and Codex Sol were used for background research, literature retrieval and review, manuscript text drafting and organization, data analysis and visualization, continuous integration of edits to produce the submitted versions of the text and figures, and adversarial simulated peer review. All model-generated content was independently verified and further edited by the co-authors, who take full responsibility for the work.
Acknowledgements
We thank the players and staff of Team Canada for their cooperation and for accommodating air sampling in their team spaces during the 2026 FIFA World Cup™.
Data and code
All data and analysis code for this study are openly available in the GitHub repository https://github.com/dholab/team-canada-world-cup-2026, which holds the tidy dataset behind every figure and the script that builds each one:
- Detection data:
analysis/data/cartridges_long.csv— one row per cartridge and target virus, with the column reference inanalysis/README.md - Figures 1 and 2:
analysis/make_figures_1_2_detections.py - Figure 3 (sequencing):
analysis/make_figure_3_sequencing.py, with dataanalysis/data/sequencing_detections.csv - Online supplemental figure 1 (wastewater):
analysis/make_supplement_1_wastewater.py
The figures show valid runs only; invalid runs are drawn grey or marked with an asterisk rather than plotted as results, and are kept in the data table.
The wastewater comparison in online supplemental figure 1 is built from per-city extracts of the public dashboards, committed alongside the figure script so the figure is reproducible without re-downloading the large source files:
- Canada (Montreal, Toronto, Vancouver):
analysis/data/ww_canada.csv, from the PHAC wastewater aggregate - Los Angeles (JWPCP):
analysis/data/ww_losangeles.csv, from the California CDPH/NWSS open dataset - Houston (69th Street):
analysis/data/ww_houston.csv, from the Rice/HHD dashboard ArcGIS feature service
Each extract has columns city, target, week, value, source, metric; metric records which non-interchangeable quantity that source reports.
Supplementary Figure S1
Online supplemental figure 1. Community wastewater surveillance context in each host city over the 2025–2026 respiratory season. Each panel (A to E) is one host city, plotting publicly reported municipal wastewater levels for the four study targets (SARS-CoV-2, influenza A, influenza B, and RSV) from August 2025 through mid-July 2026. The shaded gold band marks Team Canada’s air-sampling window in that city. The four data sources report non-interchangeable quantities and are each shown on their own independent vertical axis; levels must be read within a panel and not compared between panels. Panels A–C (Montreal, Toronto, Vancouver) use the PHAC wastewater aggregate (PMMoV-normalized index); panel D (Los Angeles) uses the California CDPH/CDC-NWSS JWPCP dataset, self-normalized to fecal load; panel E (Houston) uses the Rice/Houston Health Department 69th Street index. Across all five cities the visit windows fall in the seasonal trough, at or near each site’s own lowest values, indicating no host city was experiencing unusually high community respiratory-virus circulation while Team Canada was present.
Supplementary methods: community wastewater comparison
To place the air-sampling detections in the context of community-level respiratory-virus circulation in each host city, we retrieved publicly reported municipal wastewater surveillance data for the four study targets, covering the full 2025–2026 respiratory season (weeks beginning on or after August 1, 2025). For the three Canadian cities we used the Public Health Agency of Canada wastewater aggregate (Government of Canada Health Infobase, [42], accessed July 2026), which reports a PMMoV-normalized viral index for SARS-CoV-2 (measure covN2), influenza A, influenza B, and RSV. Vancouver is reported under the label “Metro Vancouver”, and where multiple sub-sites contributed we took the weekly median. For Los Angeles we used the California open wastewater dataset (California Surveillance of Wastewaters Network, California Department of Public Health and CDC National Wastewater Surveillance System, [43], data at [44], accessed July 2026) for the Joint Water Pollution Control Plant (JWPCP, Carson), the treatment plant serving the South Bay including Torrance, California, where the team was housed. Because that source reports absolute concentrations, we self-normalized each target to fecal load by dividing the target concentration (copies/L) by the concurrently reported human fecal marker concentration. Panel E (Houston) uses the Rice University and Houston Health Department dashboard for the 69th Street plant serving the downtown Main Street hotel, reporting the published viral-load index for SARS-CoV-2 only at plant level, scaled so that 100 represents the July 2020 baseline.
These four sources report non-interchangeable quantities on different scales, so the data cannot be compared between cities. Instead, each city is plotted on its own, with the team’s sampling window marked, and the comparison is strictly within-site, asking whether the levels the team sampled were unusually high relative to that same site’s own recent history. Non-detect values in the Canadian aggregate (reported at fixed detection-limit substitution values) were treated as non-detections. At plant level the Houston public feed reports SARS-CoV-2 only. The full per-city season is shown in online supplemental figure 1.
References
Serner A, Chamari K, Hassanmirzaei B, Moreira F, Bahr R, Massey A, et al. Time-loss injuries and illnesses at the FIFA world cup Qatar 2022. Sci Med Footb [Internet]. 2025 Aug;9(3):275–82. Available from: http://dx.doi.org/10.1080/24733938.2024.2357568
Steffen K, Soligard T, Mountjoy M, Dallo I, Gessara AM, Giuria H, et al. How do the new Olympic sports compare with the traditional Olympic sports? Injury and illness at the 2018 Youth Olympic Summer Games in Buenos Aires, Argentina. Br J Sports Med [Internet]. 2020 Feb;54(3):168–75. Available from: http://dx.doi.org/10.1136/bjsports-2019-101040
Palmer D, Engebretsen L, Carrard J, Grek N, Königstein K, Maurer DJ, et al. Sports injuries and illnesses at the Lausanne 2020 Youth Olympic Winter Games: a prospective study of 1783 athletes from 79 countries. Br J Sports Med [Internet]. 2021 Sep;55(17):968–74. Available from: http://dx.doi.org/10.1136/bjsports-2020-103514
Valtonen M, Grönroos W, Luoto R, Waris M, Uhari M, Heinonen OJ, et al. Increased risk of respiratory viral infections in elite athletes: A controlled study. PLoS One [Internet]. 2021 May 4;16(5):e0250907. Available from: http://dx.doi.org/10.1371/journal.pone.0250907
Valtonen M, Waris M, Vuorinen T, Eerola E, Hakanen AJ, Mjosund K, et al. Common cold in Team Finland during 2018 Winter Olympic Games (PyeongChang): epidemiology, diagnosis including molecular point-of-care testing (POCT) and treatment. Br J Sports Med [Internet]. 2019 Sep;53(17):1093–8. Available from: http://dx.doi.org/10.1136/bjsports-2018-100487
Grönroos W, Valtonen M, Lindblad N, Hänninen T, Luoto R, Heinonen OJ, et al. Respiratory viral infections in professional ice hockey teams-a one-season observational study. Front Sports Act Living [Internet]. 2026 Jun 23;8:1832991. Available from: http://dx.doi.org/10.3389/fspor.2026.1832991
Luoto R, Laatikainen-Raussi V, Mjøsund KE, Valtonen M, Uhari M, Ihalainen JK, et al. Viral acute respiratory illnesses in elite athletes: A 12-month controlled follow-up study. PLoS One [Internet]. 2025 Jun 2;20(6):e0322283. Available from: http://dx.doi.org/10.1371/journal.pone.0322283
Ruuskanen O, Dollner H, Luoto R, Valtonen M, Heinonen OJ, Waris M. Contraction of Respiratory Viral Infection During air Travel: An Under-Recognized Health Risk for Athletes. Sports Med Open [Internet]. 2024 May 22;10(1):60. Available from: http://dx.doi.org/10.1186/s40798-024-00725-5
Wang CC, Prather KA, Sznitman J, Jimenez JL, Lakdawala SS, Tufekci Z, et al. Airborne transmission of respiratory viruses. Science [Internet]. 2021 Aug 27;373(6558). Available from: http://dx.doi.org/10.1126/science.abd9149
Furuya-Kanamori L, Cox M, Milinovich GJ, Magalhaes RJS, Mackay IM, Yakob L. Heterogeneous and Dynamic Prevalence of Asymptomatic Influenza Virus Infections. Emerg Infect Dis [Internet]. 2016 Jun;22(6):1052–6. Available from: http://dx.doi.org/10.3201/eid2206.151080
Buitrago-Garcia D, Ipekci AM, Heron L, Imeri H, Araujo-Chaveron L, Arevalo-Rodriguez I, et al. Occurrence and transmission potential of asymptomatic and presymptomatic SARS-CoV-2 infections: Update of a living systematic review and meta-analysis. PLoS Med [Internet]. 2022 May;19(5):e1003987. Available from: http://dx.doi.org/10.1371/journal.pmed.1003987
Yu W, Guo Y, Zhang S, Kong Y, Shen Z, Zhang J. Proportion of asymptomatic infection and nonsevere disease caused by SARS-CoV-2 Omicron variant: A systematic review and analysis. J Med Virol [Internet]. 2022 Dec;94(12):5790–801. Available from: http://dx.doi.org/10.1002/jmv.28066
Walsh EE, Falsey AR. Respiratory syncytial virus infection in adult populations. Infect Disord Drug Targets [Internet]. 2012 Apr;12(2):98–102. Available from: http://dx.doi.org/10.2174/187152612800100116
Hayward AC, Fragaszy EB, Bermingham A, Wang L, Copas A, Edmunds WJ, et al. Comparative community burden and severity of seasonal and pandemic influenza: results of the Flu Watch cohort study. Lancet Respir Med [Internet]. 2014 Jun;2(6):445–54. Available from: http://dx.doi.org/10.1016/S2213-2600(14)70034-7
Schwellnus M, Derman W, Page T, Lambert M, Readhead C, Roberts C, et al. Illness during the 2010 Super 14 Rugby Union tournament - a prospective study involving 22 676 player days. Br J Sports Med [Internet]. 2012 Jun;46(7):499–504. Available from: http://dx.doi.org/10.1136/bjsports-2012-091046
Han A, Czajkowski LM, Donaldson A, Baus HA, Reed SM, Athota RS, et al. A Dose-finding Study of a Wild-type Influenza A(H3N2) Virus in a Healthy Volunteer Human Challenge Model. Clin Infect Dis [Internet]. 2019 Nov 27;69(12):2082–90. Available from: http://dx.doi.org/10.1093/cid/ciz141
Ip DKM, Lau LLH, Chan KH, Fang VJ, Leung GM, Peiris MJS, et al. The Dynamic Relationship Between Clinical Symptomatology and Viral Shedding in Naturally Acquired Seasonal and Pandemic Influenza Virus Infections. Clin Infect Dis [Internet]. 2016 Feb 15;62(4):431–7. Available from: http://dx.doi.org/10.1093/cid/civ909
Killingley B, Mann AJ, Kalinova M, Boyers A, Goonawardane N, Zhou J, et al. Safety, tolerability and viral kinetics during SARS-CoV-2 human challenge in young adults. Nat Med [Internet]. 2022 May;28(5):1031–41. Available from: http://dx.doi.org/10.1038/s41591-022-01780-9
Carmola LR, Turcinovic J, Draper G, Webner D, Putukian M, Silvers-Granelli H, et al. Genomic epidemiology of a severe acute respiratory syndrome Coronavirus 2 outbreak in a US major league soccer club: Was it travel related? Open Forum Infect Dis [Internet]. 2023 Jun;10(6):ofad235. Available from: http://dx.doi.org/10.1093/ofid/ofad235
Shamier MC, Wismans LV, van Boheemen S, Oude Munnink BB, Koopmans MPG, van Eijck CHJ, et al. Looking back on the COVID-19 pandemic in an elite sports team using whole genome sequencing. J Sci Med Sport [Internet]. 2023 Apr;26(4-5):218–21. Available from: http://dx.doi.org/10.1016/j.jsams.2023.03.010
Machtinger AN, Machkovech HM, O’Connor SL, Johnson MC, Shafer MM, Friedrich TC, et al. Community-Scale Molecular Surveillance for Human Viruses. Annu Rev Virol [Internet]. 2025 Sep;12(1):115–34. Available from: http://dx.doi.org/10.1146/annurev-virology-092623-102821
Sousan S, Fan M, Outlaw K, Williams S, Roper RL. SARS-CoV-2 Detection in air samples from inside heating, ventilation, and air conditioning (HVAC) systems- COVID surveillance in student dorms. Am J Infect Control [Internet]. 2022 Mar;50(3):330–5. Available from: http://dx.doi.org/10.1016/j.ajic.2021.10.009
Banholzer N, Zürcher K, Jent P, Bittel P, Furrer L, Egger M, et al. SARS-CoV-2 transmission with and without mask wearing or air cleaners in schools in Switzerland: A modeling study of epidemiological, environmental, and molecular data. PLoS Med [Internet]. 2023 May;20(5):e1004226. Available from: http://dx.doi.org/10.1371/journal.pmed.1004226
Temte J, Goss M, Barlow S, O’Connor DH, O’Connor SL, Ramuta MD, et al. Four methods for monitoring SARS-CoV-2 and influenza A virus activity in schools. JAMA Netw Open [Internet]. 2023 Dec 1;6(12):e2346329. Available from: http://dx.doi.org/10.1001/jamanetworkopen.2023.46329
Raymenants J, Geenen C, Budts L, Thibaut J, Thijssen M, De Mulder H, et al. Indoor air surveillance and factors associated with respiratory pathogen detection in community settings in Belgium. Nat Commun [Internet]. 2023 Mar 11;14(1):1332. Available from: http://dx.doi.org/10.1038/s41467-023-36986-z
Karatas M, Geenen C, Keyaerts E, Budts L, Raymenants J, Eggers C, et al. Shotgun metagenomics on indoor air for surveillance of respiratory, enteric, and skin viruses in a Belgian daycare setting, January to December 2022. Euro Surveill [Internet]. 2025 Sep;30(38). Available from: http://dx.doi.org/10.2807/1560-7917.ES.2025.30.38.2400711
Ramuta MD, Newman CM, Brakefield SF, Stauss MR, Wiseman RW, Kita-Yarbro A, et al. SARS-CoV-2 and other respiratory pathogens are detected in continuous air samples from congregate settings. Nat Commun [Internet]. 2022 Aug 11;13(1):4717. Available from: http://dx.doi.org/10.1038/s41467-022-32406-w
Environmental air monitoring in international airports: A novel approach for enhanced pathogen surveillance [Internet]. Available from: https://www.medrxiv.org/content/10.1101/2025.09.22.25336185v4
Bloom-Feshbach K, Alonso WJ, Charu V, Tamerius J, Simonsen L, Miller MA, et al. Latitudinal variations in seasonal activity of influenza and respiratory syncytial virus (RSV): a global comparative review. PLoS One [Internet]. 2013 Feb 14;8(2):e54445. Available from: http://dx.doi.org/10.1371/journal.pone.0054445
Gavenčiak T, Monrad JT, Leech G, Sharma M, Mindermann S, Bhatt S, et al. Seasonal variation in SARS-CoV-2 transmission in temperate climates: A Bayesian modelling study in 143 European regions. PLoS Comput Biol [Internet]. 2022 Aug;18(8):e1010435. Available from: http://dx.doi.org/10.1371/journal.pcbi.1010435
Home [Internet]. InBio. 2022 [cited 2026 Jul 15]. Available from: https://inbio.com/
Ranson C, Wootten M, Biswas A, Herrington L, Gallimore D, Jackson PD, et al. Year-round longitudinal health surveillance in UK Olympic Summer Sport Athletes 2016-2019. Br J Sports Med [Internet]. 2023 Jul;57(13):836–41. Available from: http://dx.doi.org/10.1136/bjsports-2022-105992
Post EG, Triplett AN, Anderson T, Samson O, Gidley AD, Vincent HK, et al. Beyond the field: injury and illness patterns among Team USA athletes at the Paris 2024 Olympic and Paralympic Games. BMJ Open Sport Exerc Med [Internet]. 2025 Sep 25;11(3):e002624. Available from: http://dx.doi.org/10.1136/bmjsem-2025-002624
Hernández-García M, Bassat Q, Fumado V, Rodas G, Pi R, Miranda-Garcia M, et al. SARS-CoV-2 transmission in teenagers and young adults in Fútbol Club Barcelona’s Multidisciplinary Sports Training Academy. Eur J Pediatr [Internet]. 2023 May;182(5):2421–32. Available from: http://dx.doi.org/10.1007/s00431-023-04880-x
Valtonen M, Waris M, Luoto R, Mjøsund K, Kaikkonen M, Heinonen OJ, et al. Non-SARS-CoV-2 Respiratory Viruses in Athletes at Major Winter Sport Events, 2021 and 2022. Emerg Infect Dis [Internet]. 2022 Oct;28(10):2096–9. Available from: http://dx.doi.org/10.3201/eid2810.220478
Myers NT, Laumbach RJ, Black KG, Ohman-Strickland P, Alimokhtari S, Legard A, et al. Portable air cleaners and residential exposure to SARS-CoV-2 aerosols: A real-world study. Indoor Air [Internet]. 2022 Apr;32(4):e13029. Available from: http://dx.doi.org/10.1111/ina.13029
Coyle JP, Derk RC, Lindsley WG, Blachere FM, Boots T, Lemons AR, et al. Efficacy of Ventilation, HEPA Air Cleaners, Universal Masking, and Physical Distancing for Reducing Exposure to Simulated Exhaled Aerosols in a Meeting Room. Viruses [Internet]. 2021 Dec 17;13(12). Available from: http://dx.doi.org/10.3390/v13122536
Buonanno M, Kleiman NJ, Welch D, Hashmi R, Shuryak I, Brenner DJ. 222 nm far-UVC light markedly reduces the level of infectious airborne virus in an occupied room. Sci Rep [Internet]. 2024 Mar 20;14(1):6722. Available from: http://dx.doi.org/10.1038/s41598-024-57441-z
Eadie E, Hiwar W, Fletcher L, Tidswell E, O’Mahoney P, Buonanno M, et al. Far-UVC (222 nm) efficiently inactivates an airborne pathogen in a room-sized chamber. Sci Rep [Internet]. 2022 Mar 23;12(1):4373. Available from: http://dx.doi.org/10.1038/s41598-022-08462-z
BREATHE [Internet]. ARPA-H. [cited 2026 Jul 16]. Available from: https://arpa-h.gov/explore-funding/programs/breathe
Chan LMW, Tang M, Leung ECM, Lee NYY, Chow VCY. Performance analysis of the GeneXpert respiratory panel prototype assay for the diagnosis of viral and bacterial upper respiratory tract infections. Microbiol Spectr [Internet]. 2025 Nov 4;13(11):e0256024. Available from: http://dx.doi.org/10.1128/spectrum.02560-24
Public Health Agency of Canada. National Wastewater Monitoring of Pathogens (NWMP) – Canada.ca [Internet]. 2022 [cited 2026 Jul 16]. Available from: https://health-infobase.canada.ca/wastewater/
Cal-SuWers Dashboard [Internet]. [cited 2026 Jul 16]. Available from: https://skylab.cdph.ca.gov/calwws/
CDPH-Wastewater Surveillance Data, California - California Open Data [Internet]. [cited 2026 Jul 16]. Available from: https://data.ca.gov/dataset/cdph-wastewater-surveillance-data-california